

How should you choose the right BYOB plan using credit sliders? #
Buying shoes by guessing your size wastes everyone's afternoon. Measure the foot, pick the size, adjust after a week of walking. BYOB tiers work the same way. Most teams pick wrong for two reasons: they estimate from best-case months and overspend, or they forget deployment and rework overhead and run dry mid-cycle.
The slider system rewards realistic workload numbers. Feed it honestly and it points at the right tier. Feed it wishes and it will happily sell you shoes that pinch.
TLDR #
- Estimate from actual recent usage, not idealized plans.
- Pick a base tier for normal month behavior.
- Keep top-ups for spikes, not baseline needs.
- Recalculate every month until usage stabilizes.
What is the workload-to-tier model? #
Four inputs, one estimate, one tier, one feedback loop. The loop matters more than the arithmetic. Nobody sizes correctly on the first try. Teams that converge fast beat teams that calculate precisely once.
Try it: BYOB credit estimator
How do you build a usage worksheet? #
Use recent month data, not ambitions.
| Activity | Count | Typical credits each | Estimated total |
|---|---|---|---|
| New page or feature generations | 24 | 50 to 120 | 1200 to 2880 |
| Refactors and style passes | 36 | 10 to 40 | 360 to 1440 |
| Deployments | 45 | around 5 | around 225 |
| Testing and rerun overhead | 1 bucket | 300 to 900 | 300 to 900 |
Estimated monthly band: 2085 to 5445 credits. Against BYOB's published tiers, Pro at $25 with 2,000 plus credits monthly and Max at $79 with 8,000 plus credits, as listed on byob.studio, that band points at mid Pro or higher Pro for baseline with top-ups covering heavier weeks. Your numbers will differ. The method transfers.
Count reruns honestly. Failed prompt loops burn credits whether or not they shipped anything. Teams routinely count only successes and then wonder where a third of the budget went. The usage log shows every transaction, so pull real numbers instead of reconstructing from memory.
Step 2: estimate uncertainty alongside the average #
Averages lie to volatile teams. Add a buffer.
- Stable teams: 10 to 15 percent buffer.
- Volatile teams: 20 to 30 percent buffer.
Do not pick the exact average and hope variability disappears. Hope is not a capacity plan. Months with launches, client demos, or hackathons spike hard, and the buffer is what absorbs them without an emergency top-up at midnight.
Step 3: read slider economics properly #
Moving right on the slider changes two things at once: included credit capacity and effective unit economics for top-ups. A higher tier can cost less in practice than chronic top-ups on a lower one. Stripe's usage-based billing docs describe the industry version of this shape, flat fees covering baseline with metered overage above, and the same math applies: steady overage means the baseline was set too low.
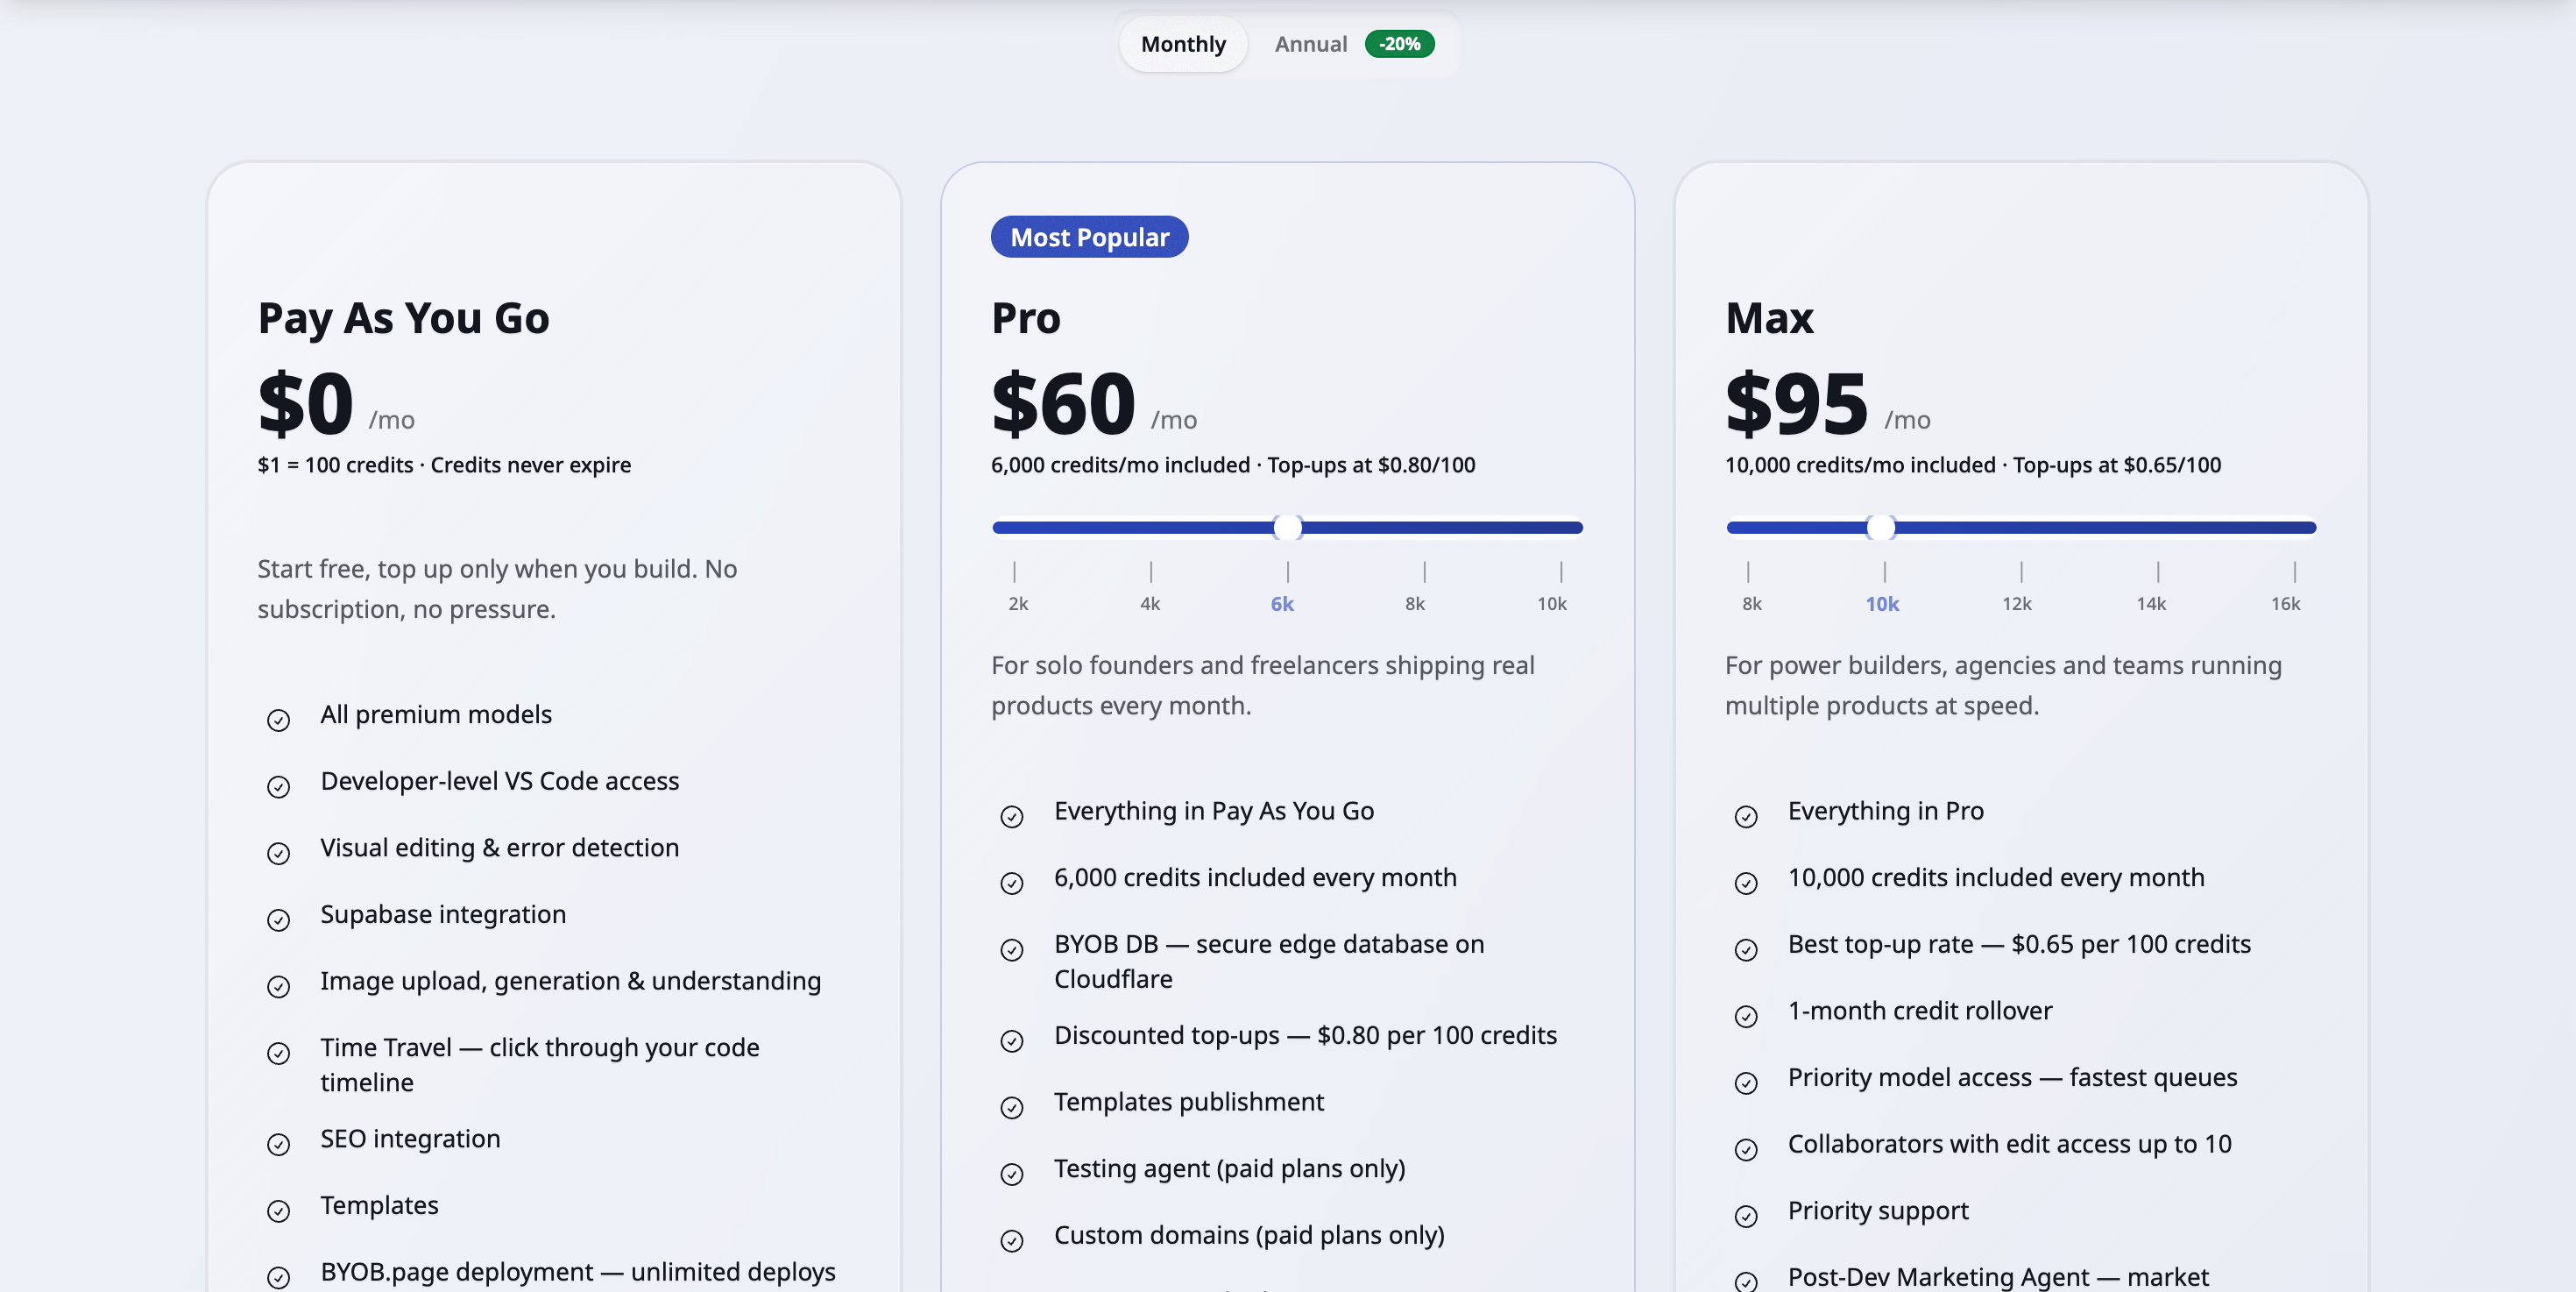
If you top up heavily every month, you are probably under-tiered even if monthly sticker price seems lower.
What are the persona-based starting points? #
| Persona | Starting tier guess | Why |
|---|---|---|
| Solo founder in early build | Low to mid Pro | Moderate generation and deploy cadence |
| Freelancer with multiple clients | Mid to high Pro | Frequent edits across projects |
| Agency with parallel sprints | Mid Max | High concurrent run volume |
| Product studio with daily launches | High Max or Enterprise | Consistent heavy throughput |
Treat these as fitting-room sizes, not prescriptions. Two agencies with identical headcounts can burn at half or double depending on prompt discipline and review process.
What cost mistakes do teams make? #
Mistake 1: ignore failed run cost #
Many teams count only successful generations. Failed loops still burn credits, and vague prompts fail more often. The worksheet bucket for reruns exists because reality demands it.
Mistake 2: ignore deployment frequency #
Frequent small deploys are good engineering and still consume credits each. Forty-five deploys at five credits is 225 credits of virtue. Worth it, but counted.
Mistake 3: upgrade before prompt quality fixes #
A bigger tier delays the bill without fixing the burn. If reruns drive your usage, sharper prompts cut costs permanently while an upgrade rents relief monthly.
How does prompt quality affect credit use? #
Treat prompt writing as cost optimization with immediate returns. Specify scope and acceptance criteria so first attempts land. Bundle related requests into one coherent instruction instead of funding five round trips. Drop contradictory style directives that force the model to guess and you to rerun. Keep a saved style guide in session so every prompt inherits constraints for free.
The mechanism underneath is concrete. Anthropic's prompt caching docs show stable prefixes getting reused across calls at roughly a tenth of base input price, while rewritten intent forces full reprocessing. Stable prompts literally cost less per token than restless ones. And model choice multiplies everything: OpenAI's catalog spans a fiftyfold input price range between flagship and budget models, so routing routine work to cheaper models shrinks the whole worksheet.
How does the monthly recalibration ritual work? #
Spend fifteen minutes at month end on five numbers.
- Actual credits consumed.
- Top-up amount and frequency.
- Credits wasted through reruns.
- Features shipped.
- Next month expected workload.
Then decide: keep, upgrade, or downgrade. Write the decision down with one sentence of reasoning. Three months of those sentences becomes a usage history that sizes every future decision correctly.
What does the decision matrix show? #
| Signal | Interpretation | Action |
|---|---|---|
| Top-ups rare, credits left over | Over-tiered | Consider lower tier |
| Top-ups frequent, runout early | Under-tiered | Increase tier |
| Heavy reruns, low ship rate | Efficiency issue | Improve prompts first |
| Stable usage near included limit | Right-sized | Keep current tier |
What are the trade-offs? #
Sizing a plan from measured workload beats guessing. The worksheet has its own cost.
| Where this path wins | Where it loses |
|---|---|
| Counting generations, refactors, deploys, and reruns turns vibes into a tier, with usage meters like Stripe describes (https://docs.stripe.com/billing/subscriptions/usage-based) | Fifteen minutes a month plus worksheet discipline is overhead a casual builder will skip |
| Stable prompts reuse cached prefixes at a fraction of reprocessing cost (https://platform.claude.com/docs/en/build-with-claude/prompt-caching), so prompt quality is a discount | Model prices span a fiftyfold range (https://developers.openai.com/api/docs/models), so one flagship habit can wreck an otherwise sound estimate |
| Top ups cover spikes without committing annual budget early | Chronic top ups signal an undersized tier. The ritual only works if you act on it |
Pick the alternative, the smallest plan with no math, when you ship one small site a month. Once weekly builds, edits, and test runs stack up, the worksheet pays for itself in one cycle.
What we learned building this #
Credit use is tracked per project from the workspace dashboard, so estimates can be checked against real burns. Tier math comes from the Pro and Max credit bundles defined per slider on the pricing page. Prompt quality matters because scoped prompts burn fewer repair cycles.
Who this is for (and who should skip it) #
This guide helps teams who burn credits across many projects and want a plan without surprises. If you can sketch weekly builds, edits, and test runs, the worksheet turns vibes into a tier.
Skip the math if you build one small site a month. The smallest plan covers you, and you can revisit the sliders when usage grows.
- Best for small teams planning credit use across many projects.
- Best for agencies forecasting builds, edits, and test runs per client.
- Best for startups picking a tier from weekly usage sketches.
FAQ #
Should I choose annual immediately? #
Only if workload is consistent for at least one or two cycles. Annual commits reward predictability you have not proven yet.
What if I undershoot tier? #
Top up and keep shipping, then increase next cycle. Undershooting costs a top-up, not a crisis.
What if I overshoot tier? #
Drop one level and monitor for two weeks. Overshooting costs a little slack, which beats running dry.
Is slider index enough to decide? #
No. Use slider with workload data and rerun behavior. The slider shows prices. Your worksheet shows needs.
Use the slider and set your tier now ->
Measure the foot, buy the shoes, walk for a month, then measure again. Sizing is a habit, not a calculation.