Start extension-based testing ->
What is the AI-powered testing workflow with the BYOB extension? #
BYOB testing is not static linting. It is a coordinated browser workflow across modal orchestration, extension connectivity, runtime routing, and structured event parsing.
Think of it as a flight recorder wired into a rehearsal. The rehearsal is your app running in a real browser, clicking and typing like a user would. The recorder captures every action, assertion, and artifact. When the rehearsal goes wrong, you do not guess. You replay.
When the workflow runs well, you get real behavior validation plus reports you can act on. This guide explains how to use it well, borrowing discipline from the best browser automation tooling in the industry.
Try it: Deploy Checklist — confirm the preview is ready before running checks.
What is the end-to-end sequence? #
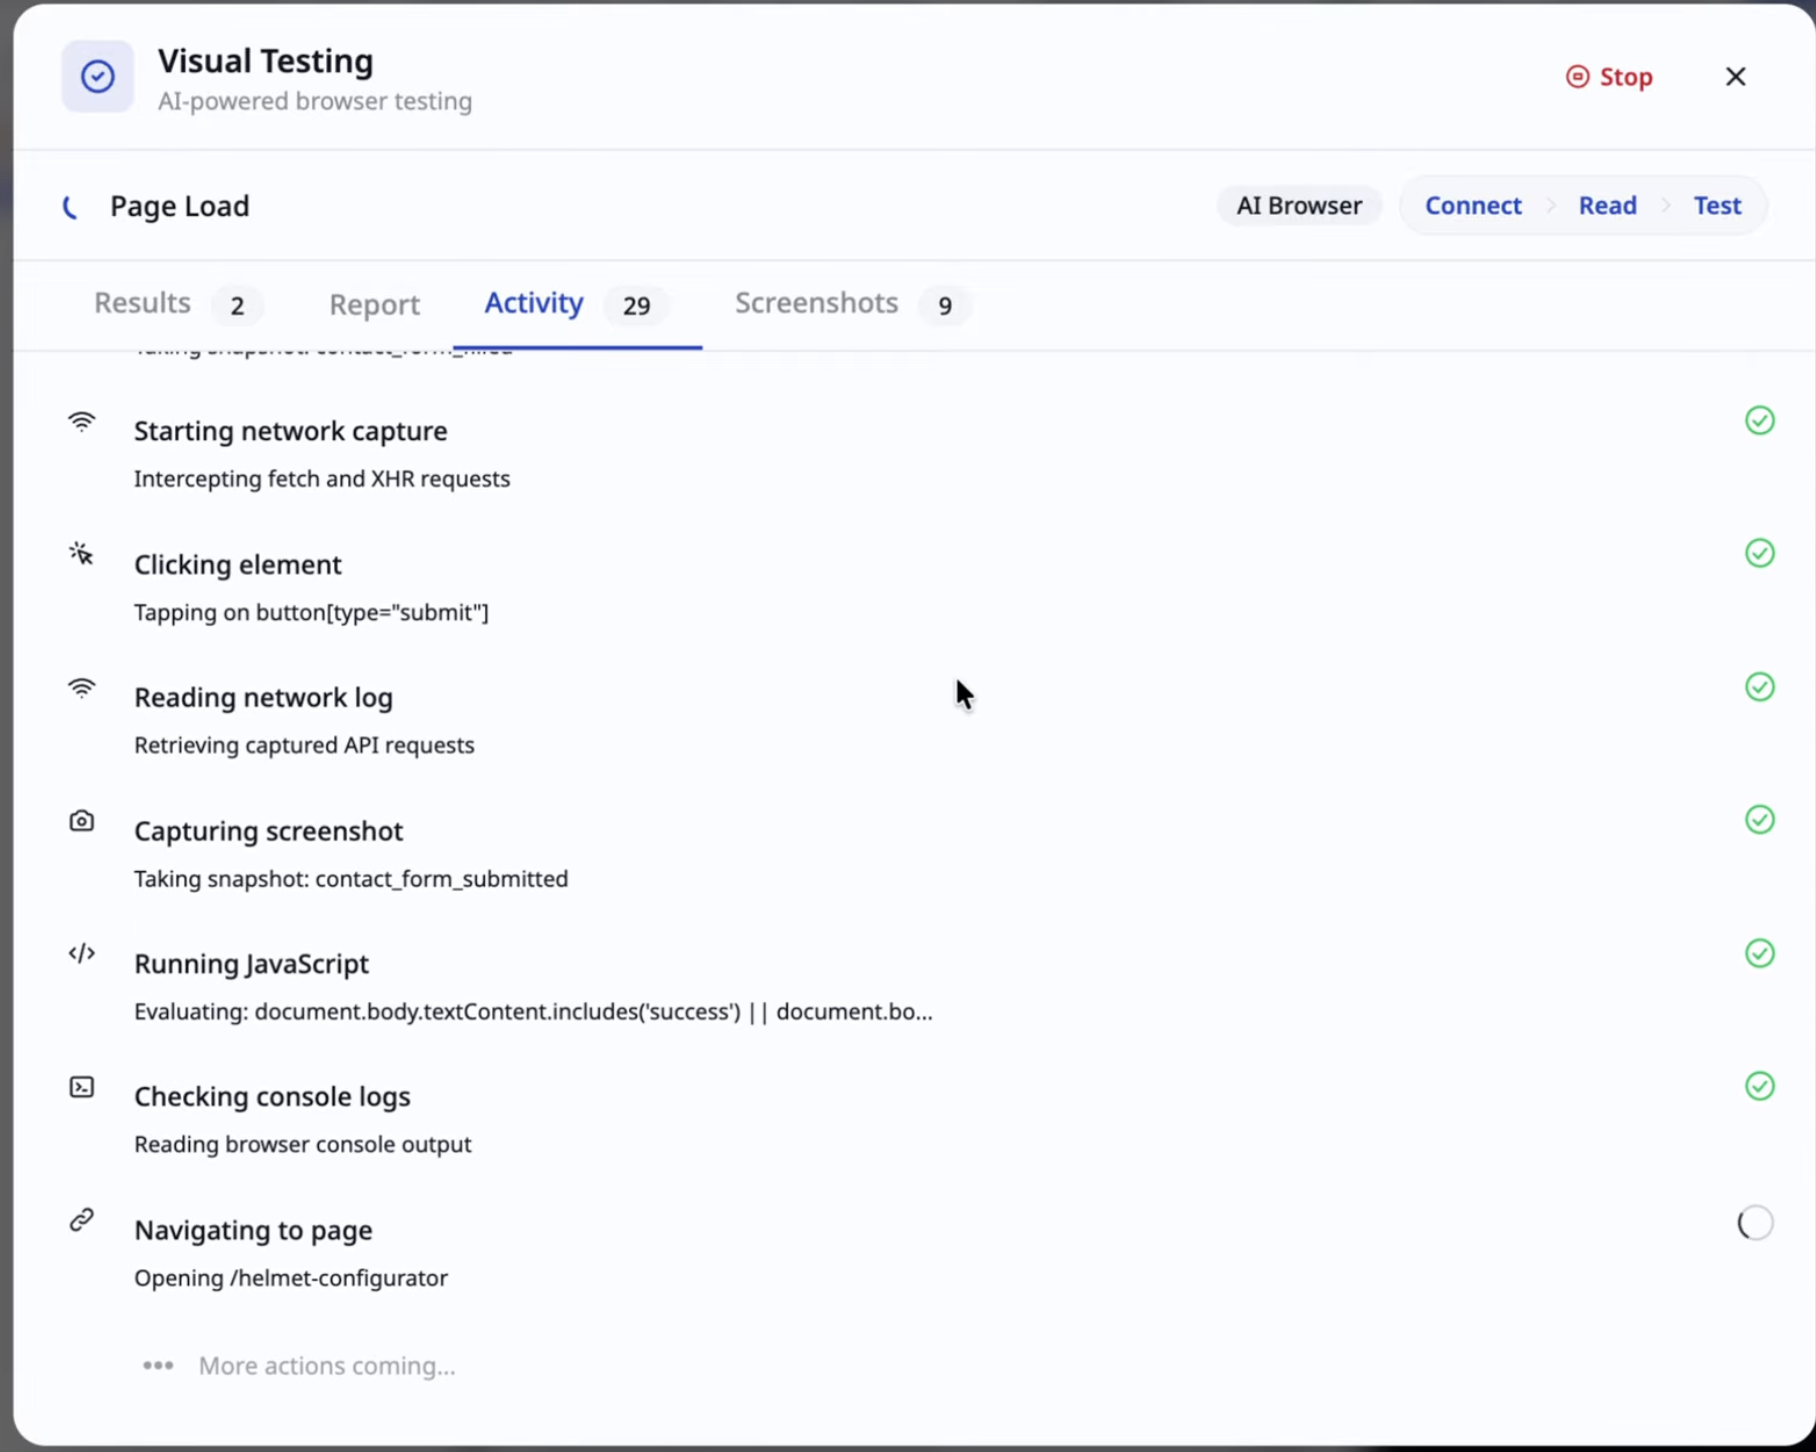
Each step hands off to the next, and each handoff can fail independently. That sounds fragile, but it is actually the design strength: when a run breaks, the phase tells you which layer to blame.
What do modal phases mean? #
The modal is honest about state. Learn its vocabulary.
Connecting means session setup plus the extension handshake. Reading means context and test configuration preparation. Testing means an active run in progress. Awaiting input means the system needs a secure user-provided value before continuing. Done means the report and artifacts are ready. Error means the run stopped with a specific failure reason.
Understanding these phases cuts debugging time in half, because "stuck in connecting" and "failing in testing" are different problems with different fixes. Never treat all red runs the same.
Why is the extension necessary for deep checks? #
Some validations need real browser state. Route transitions, click and input events, render timing and visibility, interactive element behavior. Without the extension bridge, those checks either skip or lose fidelity.
The underlying mechanics are standard browser automation. Tools in this space drive Chromium through the Chrome DevTools Protocol, which exposes domains for DOM, network, runtime, input, and performance as JSON commands and events (https://chromedevtools.github.io/devtools-protocol/). Playwright, the reference implementation most teams know, builds on the same idea: tests perform actions and assert state, with the framework waiting for actionability before each step so engineers stop hand writing sleeps (https://playwright.dev/docs/writing-tests).
Two Playwright concepts map directly onto BYOB runs. First, auto-waiting plus retrying assertions: expectations like "this heading becomes visible" are polled until they hold or time out, which is what makes browser tests stable instead of flaky. Second, isolation through fixtures: every test gets a fresh browser context, equivalent to a brand new profile, so one test cannot poison the next (https://playwright.dev/docs/test-fixtures). When your BYOB run behaves cleanly in isolation but fails in sequence, suspect shared state first. The industry already named your bug.
Test run from session start to report view
How do mid-run input requests work? #
Certain flows cannot be hardcoded. One-time auth codes, credentials for non-public test accounts, environment-specific feature toggles. When the run hits one of these, it pauses and asks.
Provide exactly what is needed and continue. Input requests are expected in realistic auth and transaction flows. They do not mean the test failed. They mean the test reached a gate that only a human can open, which is arguably the test working as designed.
Design tip from experience: keep a dedicated test account with minimal privileges for these runs. Production credentials in a test session are an incident wearing a costume.
How does the report reading framework work? #
Reports reward a triage habit. Use this grid before touching code.
| Signal | Meaning | Action |
|---|---|---|
| High pass rate plus stable history | Healthy release candidate | Move to pre-release checks |
| Failures cluster in one area | Localized regression | Patch the feature, rerun focused mode |
| Setup and connect failures dominate | Bridge or infra issue | Validate extension and runtime path |
The cluster matters more than any single red line. One failure in checkout plus green everywhere else is a product bug. Red across every route at session start is a bridge problem. Read the shape first, the lines second.
For stubborn failures, steal Playwright trace viewer discipline: record the run, then scrub through each action with its DOM snapshot, network log, and console output visible per step (https://playwright.dev/docs/trace-viewer-intro). A BYOB report with screenshots and step logs serves the same purpose. The failure you can replay is the failure you can fix.
What is in the reliability checklist before a run? #
Small rituals prevent most wasted runs.
- Confirm the extension is installed and active.
- Confirm the preview URL is reachable in a normal tab.
- Select the correct scope mode for the question you are asking.
- Keep the feature name specific when using focused mode.
- Avoid editing code during an active run.
That last one bites people constantly. Editing mid-run means the report describes an app that no longer exists. Freeze the code, run the test, then change things. Boring order, reliable results.
What are the common failure patterns? #
Pattern 1: run hangs in connecting #
Usually an extension or bridge path issue. Restart the extension, refresh the preview, start a fresh session. If a second clean session connects, the first failure was environmental. Move on without guilt.
Pattern 2: tests start but no report produced #
Often an interrupted session or an unhandled input request that timed out. Check whether the run asked for something and nobody answered. Silent stalls are usually unanswered questions.
Pattern 3: false failures on stale preview #
The preview URL changed but the run used the old endpoint. Redeploy, confirm the live URL in a tab, rerun. This pattern spikes right after big refactors, exactly when confidence matters most, so make URL verification part of the deploy ritual.
What is the team operating model? #
For teams, assign testing ownership explicitly.
The builder owns feature implementation. The reviewer owns pre-release test confirmation. The release owner signs off on the final report state. Clean lines keep accountability intact when runs fail near release windows and everyone is tired. Tired teams with vague ownership ship bugs. Tired teams with named owners ship fixes.
What is the recovery workflow for broken runs? #
When runs fail for setup reasons, follow the fast path.
- Restart the extension and refresh the preview.
- Start a fresh test session.
- Rerun the same scope with the same inputs.
- Compare the failure signature.
If the signature changes, the issue was likely in the setup path. If it stays identical, investigate product logic. Same test, same inputs, same failure means the app is telling you something. Listen.
What should you store from each critical run? #
Release decisions need paper trails. Keep the scope mode used, the feature name, the report summary, screenshot or artifact links, and the final pass or fail decision. Six months later, when someone asks why a release went out with a known flake, the log answers instead of memories arguing.
What are the trade-offs? #
The modal plus extension bridge runs checks in a real browser against the preview URL: routes, clicks, inputs, timing. Fidelity is the point.
| Where the bridge wins | Where it loses |
|---|---|
| Deep checks with real browser state and streamed event reports | Needs the extension installed, the preview reachable, and edits frozen mid run |
| Failure signatures point at setup or code fast | Auth codes and private accounts pause the run for manual input |
| Session history keeps a paper trail per scope | Flakes still need a clean second session before blame |
Pick editor checks and unit tests when no browser interaction is involved. Pick the bridge when release confidence depends on what a visitor actually clicks.
What we learned building this #
The test modal plus extension bridge runs real browser checks against the preview URL served from the project's routes, and every run streams events that become the report history. We keep the preview reachable in a normal tab before each run and freeze edits during execution so the report describes the code that ran. The live preview host and the version snapshot system in the editor give us the clean replay we rely on for triage.
Who this is for (and who should skip it) #
This guide helps if you run BYOB browser tests and want each phase and failure signature to point to the right fix instead of guessing.
If you only need static lint or unit tests without real browser interaction, you can skip the extension flow and stay with editor checks.
One limit to know. Browser tests can turn flaky if selectors depend on timing or changing text. A common mistake is running the full suite without saving the report, which makes the next failure harder to compare.
- Best for developers running BYOB browser tests before release.
- Best for small teams triaging hanging runs and stale preview faults.
- Best for startups checking risky flows with real browser proof.
FAQ #
Can I run without extension? #
Some checks can run, but browser-level fidelity is limited.
Can I inspect old runs? #
Yes. Session history stores prior run summaries and details.
Does every run produce screenshots? #
Depends on flow and test mode settings. Browser pass steps can produce visual artifacts.
Should I run full-site every commit? #
Usually no. Run feature mode during iteration, then full-site before release.